Comments
5 comments
-
 Hello Laskonka,
Thank you for for your question and the level of detail.
It's your assessment that the profiler is mislabing that code as unmanaged and you're looking at how to correct that so that you can access the associated line and method-level timings? -
 Hello Peter,
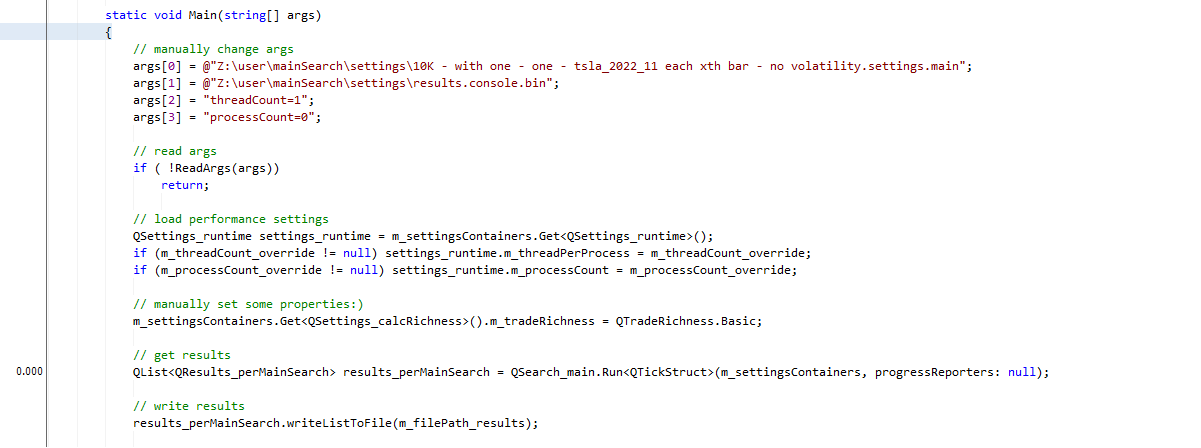
apologies, I should have made my query clearer. Yes, its exactly how you've put it. Another hint at the fact that the profiler is not showing the desired detail is the following look into the profiling results of Main - the 'get results' line is where the code spends 100% of its runtime yet the code inspector shows 0.000.
Thank you,
J. -
 Okay, I figured the problem out.
At startup, the application reads data from the hard drive - to speed this up, several Tasks are created for parallel reads. After all the Tasks are finished, their threads return to the threadpool. For some reason, these threads continue to be included into profiling results.
J. -
 Thank you so much for tracking this down, that's clearly not the intended behaviour, I'll raise this with development.
Greatly appreciated for helping us improve our products. -
 Hi @Laskonka,
Would you be able to share your solution or an example solution that reproduces the issue? If so, we can contact you from a support ticket to get the files to pass on to the development team.
Kind regards,
Alex
Add comment
Please sign in to leave a comment.
Im evaluating the profiler and compared to the built-in VS profiler, it is awesome. I have one problem though.
I have a
- single-threaded console .NET 6.0 application
- all of the code is mine, there are no 3rd party dependencies
- there are no Threads or Tasks used in the profiled code
- the code spends about 30% in calculation-intensive methods that I want to profile
The result of profiling is shown below- the code supposedly spends 93 percent of time in unmanaged code
- the Visual Studio built-in profiler doesn't show this and correctly shows that a 30% of runtime is spent in methods to be profiled
How can I fix this?Thank you,
J.