Comments
5 comments
-
 Could you please send me the relevant log file located in a directory like:
C:\Documents and Settings\Uwe.Keim\Local Settings\Application Data\Red Gate\ANTS Performance Profiler 4
This should enable us to diagnose this error. Please email it to supportATredDASHgateDOTcom. Also, please reference this forum post in your email, so the log file will definitely get to me. -
Just mailed them.
Under Windows Vista I found them at
C:\Users\ukeim\AppData\Local\Red Gate\ANTS Performance Profiler 4
Thanks
Uwe -
I received the log files. Thanks!
You're getting OutOfMemoryExceptions (OOMs) in the profiler UI. This may be caused either by your application being very complex, or by a memory leak in the ANTS Profiler UI.
Just one more question: what is the rough memory usage of ANTS Profiler during your profiling? When you stop profiling and retrieve results, what is the total memory usage of ANTS Profiler?
In order to prevent future OOMs, I can make the following suggestions for settings in Tools -> Options:
- Turn on 'Avoid profiling trivial functions' (you already do this)
- Turn on 'Simplify Complex Stacks' (you already do this)
- Turn on 'Enable Inlining' (currently, you have this turned off)
Also, profiling in lower detail modes (e.g. method-level timings only) uses less memory. -
This is the current memory consumption after my profiled application has stopped:
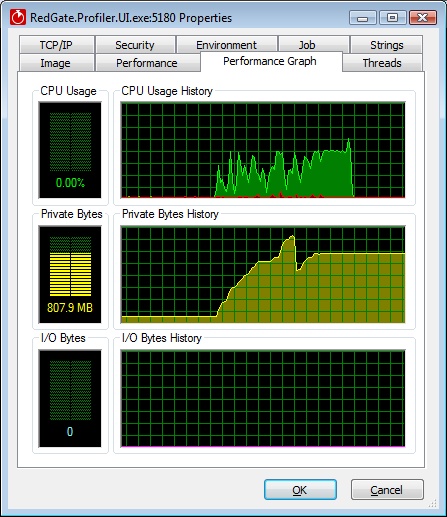
Regards
Uwe -
That is interesting - it suggests it's probably a memory leak in ANTS Profiler itself, rather than it just needing lots of memory to store results. We at Red-Gate will need to hunt for this leak, thanks!
Add comment
Please sign in to leave a comment.
After stopping profiling and browsing for approx. 10 Minutes through the results, the application crashes.
(Windows Vista, ran as Admin as suggested by the startup popup message).
Question: Any hints?