Well done on a promising product in SQL Response. I personally have benefited from the "Recommendations" pane - not being a DBA, it's great to see at-a-glance the health (or otherwise) of my databases.
I have a few suggestions after using the tool for a couple of days, particularly the "Recommendations" tab:
1) Add an option to ignore recommendations for specific databases e.g. ReportServer, tempdb
2) The "delete" key on the keyboard should delete items in the list of recommendations
3) On a recommendations list with a lot of items, selecting one at the bottom of the list brings up the detail panel which in turn covers the item. The behaviour I expected (in keeping with SQL Compare) is that the list should be scrolled automatically, so that the selected item is visible above the detail panel.
4) In the recommendations list, it would be helpful to link to online instructions on how to carry out the selected recommendation, perhaps in a Red Gate "knowledge base" or MSDN library (someone in the forums also suggested giving the code to fix the problem, which is fine as long as the side-effects and risks are noted)
5) Although the recommendations list refreshes automatically, it would be good to have a "Refresh" button in order to update after changes have been made to the monitored server e.g. I receive a recommendation to defragment an index, I do so in the specified table, delete the item in the recommendations list, and then click refresh to make sure
6) The details panel for the recommendations list should not have an "Incident" subpanel with the "Close", "Reopen", "Delete" buttons, but should have a "Recommendations" subpanel
7) +1 to previous forum suggestion to stop monitoring SQL Response long running queries
8) +1 to other forum posters who describe a threshold for low memory, high CPU, or even long-running queries. It could be simplified with a hierarchy of "Production server", "staging server", "test server" settings
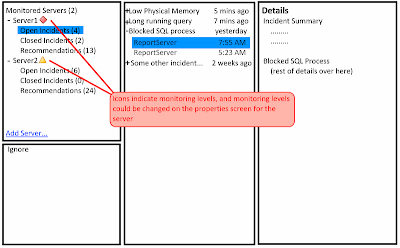
9) OK, this is only a suggestion that addresses the initially confusing "how do I put a server into a higher or lower monitoring level?". Could a simpler model for representing the monitoring levels ("Intensive", "Frequent") be icons in a treeview, like the following (yes, heavily borrowed from Outlook):

I hope this helps!
I have a few suggestions after using the tool for a couple of days, particularly the "Recommendations" tab:
1) Add an option to ignore recommendations for specific databases e.g. ReportServer, tempdb
2) The "delete" key on the keyboard should delete items in the list of recommendations
3) On a recommendations list with a lot of items, selecting one at the bottom of the list brings up the detail panel which in turn covers the item. The behaviour I expected (in keeping with SQL Compare) is that the list should be scrolled automatically, so that the selected item is visible above the detail panel.
4) In the recommendations list, it would be helpful to link to online instructions on how to carry out the selected recommendation, perhaps in a Red Gate "knowledge base" or MSDN library (someone in the forums also suggested giving the code to fix the problem, which is fine as long as the side-effects and risks are noted)
5) Although the recommendations list refreshes automatically, it would be good to have a "Refresh" button in order to update after changes have been made to the monitored server e.g. I receive a recommendation to defragment an index, I do so in the specified table, delete the item in the recommendations list, and then click refresh to make sure
6) The details panel for the recommendations list should not have an "Incident" subpanel with the "Close", "Reopen", "Delete" buttons, but should have a "Recommendations" subpanel
7) +1 to previous forum suggestion to stop monitoring SQL Response long running queries
8) +1 to other forum posters who describe a threshold for low memory, high CPU, or even long-running queries. It could be simplified with a hierarchy of "Production server", "staging server", "test server" settings
9) OK, this is only a suggestion that addresses the initially confusing "how do I put a server into a higher or lower monitoring level?". Could a simpler model for representing the monitoring levels ("Intensive", "Frequent") be icons in a treeview, like the following (yes, heavily borrowed from Outlook):
I hope this helps!