Comments
6 comments
-
 Official comment
Hi Al,
It's worth noting that when SQL Server dumps like that, it's a SQL Server issue - the T-SQL being run is valid - and MS support should be passing the information from the stack dumps to the SQL Server team to investigate and fix.
Having said that, I understand it's important to prevent your servers going down because of that by disabling the sampler, and so those steps are as follows:
- Find the ConfigurationFileEditor.exe tool included under the
C:\Program Files\Red Gate\Redgate Monitor\BaseMonitor\Toolsdirectory of a Base Monitor installation. - Right click and run the tool as an Admin
- Click on the Load Configuration File option and then select the "RedGate.Monitor.BaseMonitor.exe.settings.config" which should be residing under the
C:\ProgramData\Red Gate\Redgate Monitordirectory by default- It's recommended that you save a copy of the config file elsewhere before editing it further though it should also save a copy itself.
-
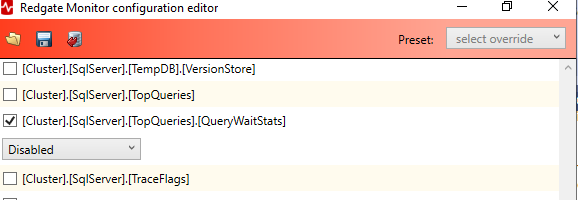
Once you've loaded the config file, find the [Cluster].[SqlServer].[TopQueries].[QueryWaitStats] channel, check the box next to it, then select the dropdown box and choose “Disabled”
-
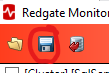
Then click the disk save icon at the top left of the utility:
- Once you have done that, please then restart the Base Monitor service
The above will disable the sampler for all the entities you are monitoring. You can then edit the XML that is added to the RedGate.Monitor.BaseMonitor.exe.settings.config file as described on this documentation page https://documentation.red-gate.com/monitor/monitoring-servers-without-sysadmin-permissions-239667635.html in step 4b to add the clusterName and sqlServerName properties to the XMl to disable it specifically for the one entity. The clusterName is the top level name seen in Redgate Monitor and the sqlServerName is the portion that comes after the backslash "\" in the entity names. Both should be in all lower case to match what is seen in Redgate Monitor, except for (local) instances which are internally represented as an empty string
“”.An example of this for my Windows VM named WinVM with a default SQL instance on it, I would have this as the XML between the <collectionSchedules> tags:
  <schedule qualifiedChannelName="[Cluster].[SqlServer].[TopQueries].[QueryWaitStats]" clusterName="winvm" sqlServerName="">
    <disabledSchedule />
  </schedule>
I hope that helps, but please do let me know if you have any further questions and if you need specific help with this for your entity, please raise a support ticket referencing this forum post and we can reply there for your specific case.
Kind regards,
Alex
- Find the ConfigurationFileEditor.exe tool included under the
-

Hi Alex,
The Query Wait Statistics has been disabled in Redgate Monitor for our critical SQL Server with a default instance. Thank You!
Question,
How do I verify the Query Wait Statistics are actually disabled; is there a TSQL query that I can run to verify?
Reason that I am asking is I still see two “Redgate Monitor - Monitoring” sessions connected to the TempDB database in suspended status on our default instance.
Thanks, again,
Al
-
Hi Al,
You are most welcome!
There are three that are normally in tempdb: one for Top Queries, one for query wait stats, and one for sproc stats (related to the Top procedures).
If you look at the tables in tempdb > tables, you should see the a and b tables dbo.redgate_sqlmonitor_topqueries_<a|b>_xxxxxx, dbo.redgate_sqlmonitor_SprocStats_<a|b>_xxxxxx but you will no longer see the dbo.##redgate_sqlmonitor_querywaitstats_<a|b>_xxxxxx tables in the tempdb > Temporary Tables section.
And in the product, if you go to the Top queries section, expand one of the entries and then scroll down to the table that has “Wait type” as the first column header, you should not see any data there for any of the queries.
Kind regards,Alex
-
Hi Alex,
We have not had a Stack Dump due to ##redgate_sqlmonitor since disabling Query Wait Statistics.
Thank You for your knowledge and wisdom!
Al
-
Hi Al,
Great to hear, glad that's sorted it for you!
Kind regards,
Alex
-
Hi Alex,
Is there a tsql query I can execute that will return the top queries for the top wait stats?
We want to know what are the top statements for our top SQL server wait stats without needing to enable the [Cluster].[SqlServer].[TopQueries].[QueryWaitStats] in the ConfigurationFileEditor.exe tool.
Thank You!
Al
Add comment
Please sign in to leave a comment.
How do I disable the Query Wait Statistics for our monitored SQL Server instance in our Redgate Monitor repository database?
Redgate Monitor has caused two SQL Stack Dumps on our business critical SQL Server this week.
After reviewing the SQL error log, support suggested we disable the Query Wait Statistics for our monitored SQL Server instance in our repository database.
However, the code provided by Support does not work for our version of Redgate monitor.
We are using Redgate Monitor version 14.0.38.1098 on MSSQL Server 2016 on Windows Server 2016 Standard.
Can someone with knowledge of Redgate Monitor version 14.0.38.1098 provide the T-SQL code to disable Query Wait Statistics for a SQL server instance in our Redgate Monitor database?
Thank You!