Good day -
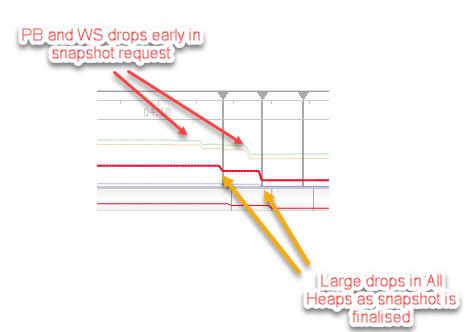
I'm trying out the ANTs Memory profile and see this behaviour where taking a snapshot regularly (not always) causes the memory to drop. There's an initial drop in private bytes etc shortly after the snapshot button is pressed, and then a drop in All Heaps as the snapshot is finalised.
If I perform the same actions in the profiled application but do not request a snapshot, the memory remains constant - I don't see the drops.
Could someone explain what is happening here? I'm guessing a GC collect or similar is being triggered to get a clean view of the memory - but if this is the case, why does the GC not clean up the memory in time if I just wait, with no snapshot?
Thanks,
Peter