Comments
4 comments
-
 Hi @AlexBrunner,
So sorry for this issue you're running into!
The Event Log unfortunately doesn't give much detail on where things are going wrong. To help us narrow down what's happening, can I please check if the problem still occurs if you profile in Sampling mode, rather than with line-level or method-level timings?
Does it happen even if you disable Tools>Advanced Options>Profile with Async awareness? -
 Hi Jessica
Thanks for contacting me.
Switching "Profile with Async awareness" off doesn't Change anything.
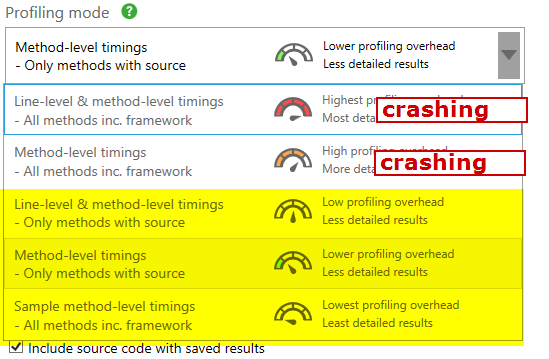
It works in the following yellow marked modes:
The application is running with .NET Framework 4.7.2 and is explicitly built as x86.
The same application build as x64 is running normally.
Best regards,
Alex
-
 Hi Jessica
Any progress on this?
Best regards,
Alex
-
 Apologies for the delay, @AlexBrunner! Do you recall if this was working before with a previous version of the profiler? Would it be possible for you to share your application with us to test with?
Add comment
Please sign in to leave a comment.
The eventlog entry Looks as follows:
Name der fehlerhaften Anwendung: RedGate.Profiler.UI.exe, Version: 10.1.9.1470, Zeitstempel: 0x5d936d05
Name des fehlerhaften Moduls: KERNELBASE.dll, Version: 10.0.17763.348, Zeitstempel: 0xd620e319
Ausnahmecode: 0xc0020001
Fehleroffset: 0x0000000000039149
ID des fehlerhaften Prozesses: 0x4660
Startzeit der fehlerhaften Anwendung: 0x01d592f89d9420a6
Pfad der fehlerhaften Anwendung: C:\PROGRA~1\Red Gate\ANTS Performance Profiler 10\RedGate.Profiler.UI.exe
Pfad des fehlerhaften Moduls: C:\WINDOWS\System32\KERNELBASE.dll
Berichtskennung: 37719396-95f7-4431-be41-6daf6466c706
Vollständiger Name des fehlerhaften Pakets:
Anwendungs-ID, die relativ zum fehlerhaften Paket ist: