Many installation failures can be due to two things that are worth checking prior to troubleshooting:
- Are you installing the latest version of the tool?
- Do you have .Net Framework 4.6.1 or later installed?
If you are still experiencing problems installing, here's some troubleshooting steps you can try:
Finding Installers
Upgrading
Out of entitlements when activating your license
Trial Expired message on a licensed product or after upgrading
SSMS plug-ins are missing from new SSMS install
Using Check for Updates
Unable to connect to the Redgate Client Service when activating
Finding Installers
There are several ways to find the installers you need for your Redgate tools.
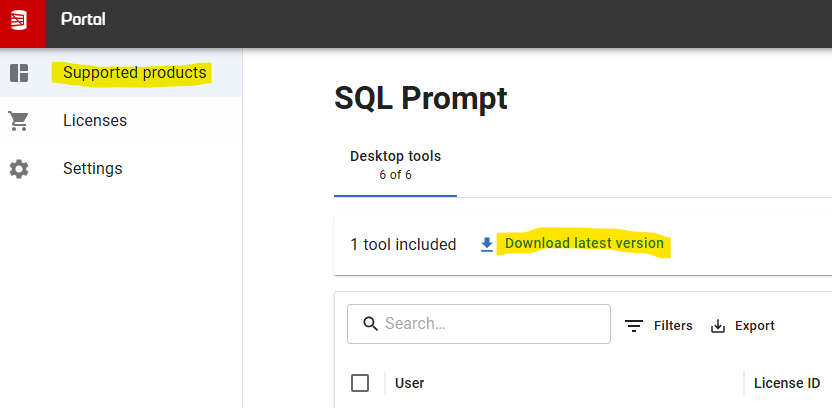
Log in to the customer portal
You can access the details of your Redgate licenses by logging into your Redgate account on our website.
The first view you see in the Supported products page shows a summary of the licenses associated with your account. Click on a product tile and you can download the latest version of that tool:
On your invoice
When you purchase a Redgate license the download link for the installer is on the invoice.
On the Redgate download site
You can find installers for all the product versions you require, current or older versions, here:
https://download.red-gate.com/
NB: If you're looking for Redgate Monitor installers they are under https://download.red-gate.com/checkforupdates/RedgateMonitorWebService/
Out of entitlements when activating your license
If you are getting the activation error 'Failed to activate the license: All of the x entitlements for serial xxx-xxx-xxxxxx-xxxx have already been claimed' you may not be logged in or the license may already be in use. Please follow the steps in this article:
All Entitlements Claimed Error when Activating a License for a Desktop (Client) tool
Upgrading
You can download the latest version of a product using Check for Updates, the customer portal or the Redgate website.
You can install the latest major version of our standalone desktop tools on the same machine as the previous version. Some users prefer to run an old version alongside the latest version to compare old databases that aren't compatible with the latest version of the tool.
However, installing a minor release will upgrade the existing installation. Our server tools (e.g. Redgate Monitor, SQL Backup) and tools which operate entirely within SQL Server Management Studio and Visual Studio will always upgrade the existing installation.
To revert to an earlier version, uninstall the later version, then download and install the version you want from the Release notes and other versions page on the documentation site. You can use a serial number for a later version to activate an earlier version.
Troubleshooting
Before upgrading you may want to check the system requirements which can be found on the documentation site by choosing your product and then clicking Requirements.
If you run into any problems after upgrading a Redgate tool, SQL Server Management Studio or SQL Server, in most cases an uninstall and subsequent reinstall of the Redgate tool should fix the problem.
Trial Expired message on a licensed product or after upgrading
This error message is displayed if you have upgraded to a new major version or downloaded an upgrade from the Redgate website which reverts to trial mode. If you have a license and you run into this error you will need to activate your serial key within the tool. You can do this one of two ways depending on the product and version you're using:
-
On the Help menu, select Manage my license
-
On the Help menu, select Enter serial number
This will put you back into licensed mode.
SSMS plug-ins are missing from new SSMS install
After installing a new version of SSMS you may need to reinstall the plug-ins (SQL Prompt, SQL Source Control, SQL Test, SQL Search) if they no longer appear in the menu bar.
1. From Control Panel, uninstall the tools needed in the new SSMS install
2. Run the latest installer for the tools
Using Check for Updates
The Check for Updates service checks whether a more recent version of the product is available to download. To use the service, your computer must have a connection to the internet. If your internet connection uses a proxy server, make sure your web browser connection settings are configured correctly.
To check for updates for a Redgate product, on the Help menu, click Check for updates. Any available updates are listed:

To view the full release details in your default web browser, click Details.
To get the update, click Install. If you have a choice of updates, choose by selecting a different upgrade from the dropdown, and then click INSTALL.
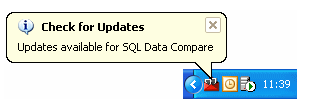
About the Check for Updates service
When you start the application, the Check for Updates service informs you automatically when there are updates available:
If you don't want to receive these notifications for the product, clear the Check for updates on startup check box.
If you don't want the Check for Updates service to inform you about a particular update again, select the Don't tell me about this version again check box. The Check for Updates service will still inform you of new updates when they become available.
Unable to connect to the Redgate Client Service when activating - legacy licensing system
To restart the Redgate Client Service open your Services console (Control Panel > Admin Tools > Services), select Redgate Client in the list of services and click Start.
If this doesn't resolve the problem please send the latest full Redgate Client Logs which can be found in C:\ProgramData\Red Gate\Shared Client\Log to Redgate support.
For Redgate Client Service troubleshooting help see Redgate Client Service fails to start.


