Comments
3 comments
-
 Hi @rgelb!
The documentation here explains the timings in async mode: https://documentation.red-gate.com/display/APP9/Async+in+the+call+tree
Regarding the hit count in the source view, this does refer to the number of hits based on the selected time region.
Hope that helps! -
Hi,
I am using Performance Profiler 9 version and I also see some difficulties in understanding of Time values.
Please see attach image. GUIManager.DoCheck() method is showing Time(ms) = 2.494 , Time with Children(ms) = 5958.451 and AverageTime(ms) = 2.494
But on the other hand when we see code line it is almost change.
So my question is what is actual time taken by method to response.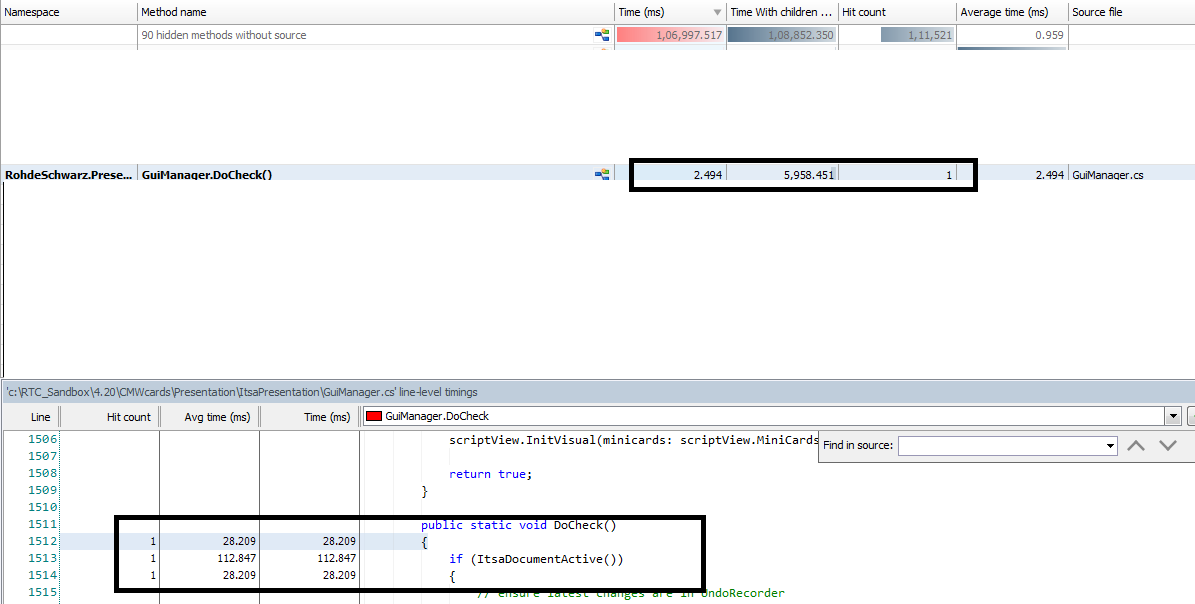
-
Hi @AmitVerma!
Can I just double check if you have the entire timeline selected?
The source view provides timings based on the entire profiling session, whereas the call tree gives timings only for selected timeline region. With that, the source view may be showing results for more of the timeline than what is selected. If you select the entire timeline, that may show timings more in line with each other.
The timings in the source view, however, can often still exceed the timings in the call tree. This is because the source view is showing the timing for entire lines, which includes not just the total time taken to execute methods, but also the total time spent setting the values for local variables, validating if statements, etc...
Add comment
Please sign in to leave a comment.
Secondly, the screenshot below. Does the Hit count and Time columns refer to the number of hits for the slice of time I selected on the bookmark bar or for the entire profiling session? I am assuming the former.