Comments
16 comments
-
 Hi @rgelb,
Sorry to hear you're running into some trouble with profiling!
We may need to get a crash dump to get a better idea of what's going wrong. Can I please first check though-- is there any related error information in Event Viewer>Windows log>Application? -
Hi @Jessica R
I cleared out the Event Viewer, repeated the test and it crashed again. The Event Viewer had the following things (separated by carriage returns):
.NET Runtime version 4.0.30319.0 - The profiler was loaded successfully. Profiler CLSID: '{F487E236-8315-45AF-833E-DF0967B1E79A}'. Process ID (decimal): 364. Message ID: [0x2507].
The Open Procedure for service "BITS" in DLL "C:\Windows\System32\bitsperf.dll" failed. Performance data for this service will not be available. The first four bytes (DWORD) of the Data section contains the error code.
The configuration information of the performance library "C:\Windows\System32\perfts.dll" for the "TermService" service does not match the trusted performance library information stored in the registry. The functions in this library will not be treated as trusted.
Faulting application name: w3wp.exe, version: 10.0.15063.0, time stamp: 0xacce422f
Faulting module name: unknown, version: 0.0.0.0, time stamp: 0x00000000
Exception code: 0xc00000fd
Fault offset: 0x3636e10b
Faulting process id: 0x16c
Faulting application start time: 0x01d30fde87182b0a
Faulting application path: C:\WINDOWS\SysWOW64\inetsrv\w3wp.exe
Faulting module path: unknown
Report Id: b7193eb4-f29b-47fa-bf35-5ba0de499542
Faulting package full name:
Faulting package-relative application ID:
I then selected to "debug" the w3p crash using a new copy of Visual Studio and it pinpointed this line of code in our code base:
result = engine.Invoke(outputType, renderOptions.ComponentName, properties).ToString();
The error was Stack Overflow.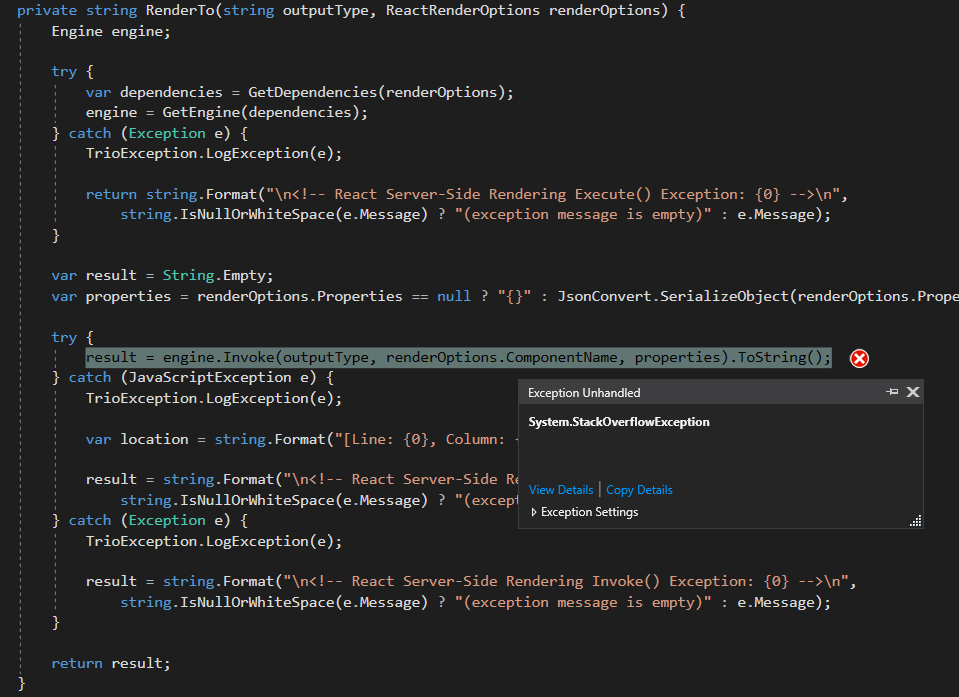
As I mentioned before none of these errors happen if I profile without line level stats.
-
Hi @Jessica R
I cleared out the event log and recreated the crash. Event log had the following entries:
.NET Runtime version 4.0.30319.0 - The profiler was loaded successfully. Profiler CLSID: '{F487E236-8315-45AF-833E-DF0967B1E79A}'. Process ID (decimal): 364. Message ID: [0x2507].
The Open Procedure for service "BITS" in DLL "C:\Windows\System32\bitsperf.dll" failed. Performance data for this service will not be available. The first four bytes (DWORD) of the Data section contains the error code.
The configuration information of the performance library "C:\Windows\System32\perfts.dll" for the "TermService" service does not match the trusted performance library information stored in the registry. The functions in this library will not be treated as trusted.
Faulting application name: w3wp.exe, version: 10.0.15063.0, time stamp: 0xacce422f
Faulting module name: unknown, version: 0.0.0.0, time stamp: 0x00000000
Exception code: 0xc00000fd
Fault offset: 0x3636e10b
Faulting process id: 0x16c
Faulting application start time: 0x01d30fde87182b0a
Faulting application path: C:\WINDOWS\SysWOW64\inetsrv\w3wp.exe
Faulting module path: unknown
Report Id: b7193eb4-f29b-47fa-bf35-5ba0de499542
Faulting package full name:
Faulting package-relative application ID:
I chose to debug the w3p crash using a new copy of Visual Studio and it pinpointed the following line with the Stack Overflow exception:
result = engine.Invoke(outputType, renderOptions.ComponentName, properties).ToString();
-
Thanks for those details!
If you don't already have "simplify very complex stack traces to save memory" (Tools>advanced Options) enabled, does turning it on prevent the error?
Or should that not help, does it make any difference if you also disable "Profile with async awareness" (Tools>advanced Options) as well as all the "Additional profiler options" (for example "Record file I/O", "Profile child processes", etc...)? -
@Jessica R
So I tried suggestions you made. Unfortunately it didn't help. I disabled "Profile with async awareness" and disabled all options in "Additional profiler options".
Alternatively I got either crashes or "Operation could destabilize the runtime" error. I am not sure what leads to this error.
One thing that does work is line level profiling until the crash (which happens shortly after I press Start Profiling).
So I am at a loss. Any other suggestions?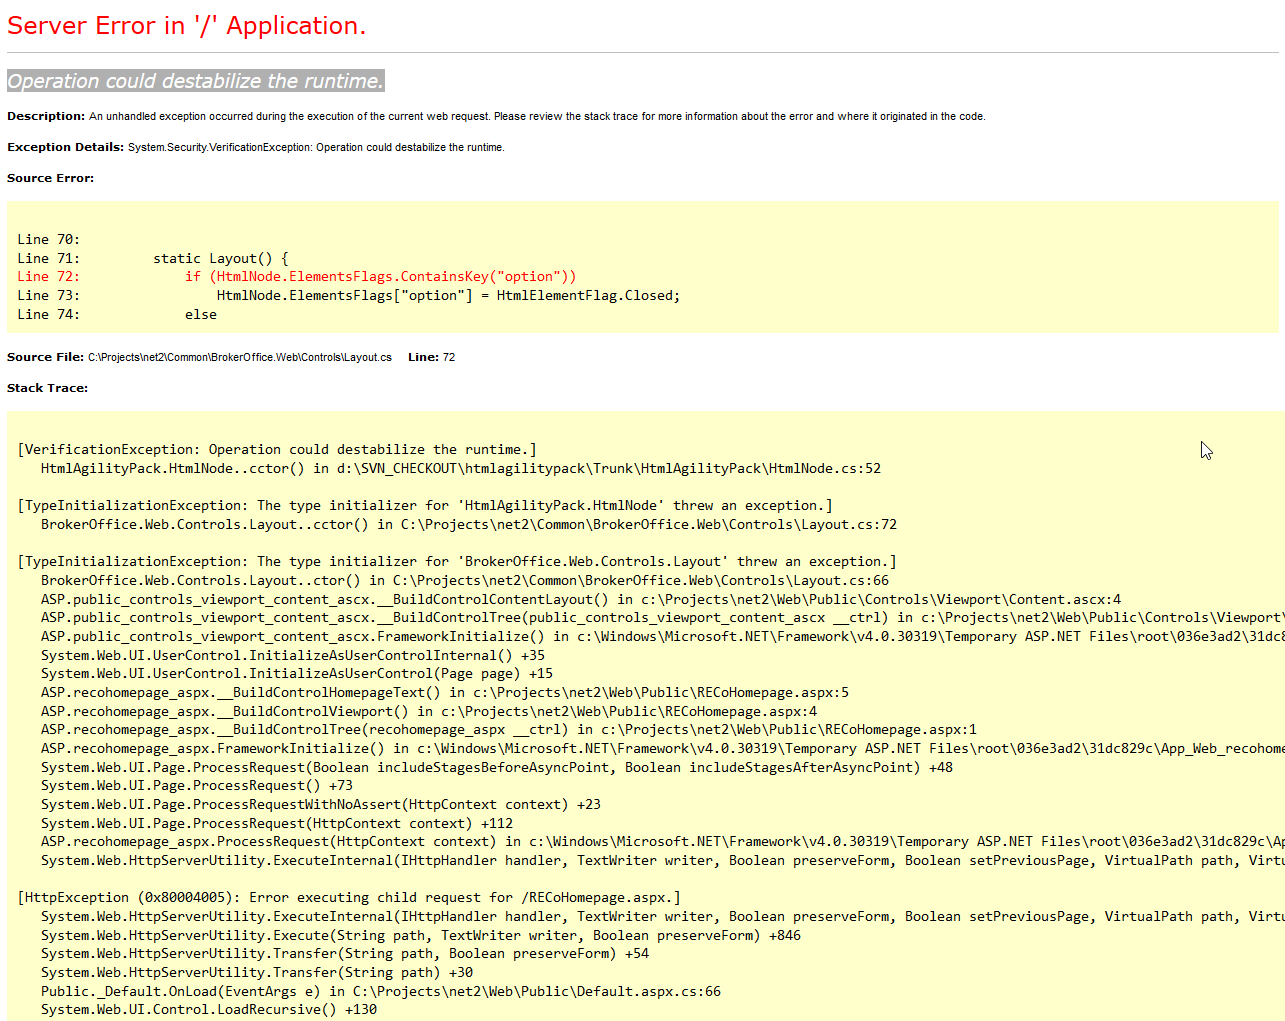
-
Thanks for trying that and sorry to hear things still aren't working!
I think disabling one (or more) of those options actually did help with the original error and we're just encountering a different issue now.
The "Operation could destabilize the runtime" error will usually come up if an assembly that you are profiling has some security settings that will not allow it to be instrumented (which the profiler will need to do to provide method and line-level timings). To get around this, you can:
If you have the source for the assembly throwing the error, add [assembly: SecurityRules(SecurityRuleSet.Level1, SkipVerificationInFullTrust = true)] to the assemblyinfo.cs file of the assembly and rebuild
or
If you don't have the source, you can add the offending dll to the profiler's line-level blacklist. You can do this by adding the following line to the LineLevelBlacklist.xml file in %localappdata%\Red Gate\ANTS Performance Profiler 9: <assemblyName>OffendingDLL.dll</assemblyName>
Can you please give this a try?
-
@Jessica R That worked! I added the Security rules attribute and it did the trick. Thank you very much.
w3p.exe still crashes if Enable Inlining is checked, but I don't think I need that . I was also able to turn Async Awareness on.
I'll have to look into that assembly and see what security settings might be going on. Any ideas of what I should be looking at? -
Woo, that's great to hear!
What I understand about the "operation could destabilize the runtime" error is that it will occur when the runtime fails to validate IL at a very low-level and the code is only partially trusted. With that, it seems that the runtime fails to validate the IL to construct HtmlAgilitypack.HtmlNode when the IL injected by the profiler is there to instrument the method. Enabling full trust for the assembly though allows it to be executed. -
@Jessica R I meant to get back to this earlier. I am back to the "Operation could destabilize the runtime" error. I've added the assembly, which contains the code in the screenshot lives, to the LineLevelBlacklist.xml and it seems to ignore the file.
I've also downgraded to Ants Profiler 8.6 and it's showing the error there too. And I've added the assembly to %localappdata%\Red Gate\ANTS Performance Profiler 8\LineLevelBlacklist.xml.
Is it possible that runtime destabilization happens somewhere else and the code that's displayed is a red herring? -
Hi @rgelb!
As far as I'm aware, it's the line that throws the error that is having the runtime destabilization issue, but is adding the file to the LineLevelBlacklist not working? -
@Jessica R
No, LineLevelBlacklist doesn't seem to be working. -
Ah so sorry @rgelb, I've realized that I had given the wrong format for adding an assembly to the linelevelblacklist which may explain why it's not working. It should be:
<assemblyName>OffendingDLL</assemblyName>
(without the .dll extension)
Can you please give this a try?
Should that still not help though, can I just confirm if the error still happening at the same point, after the call to HtmlAgilityPack.HtmlNode..cctor()? Can you please share the content in your linelevelblacklist file for us to take a look? -
@Jessica R I think I figured it out. Placing my assembly into LineLevelBlackList.xml was not necessary. Neither was increasing permissions on my assembly in AssemblyInfo.cs I just added HtmlAgilityPack into the file and that did the trick.
The odd thing is that I do not have source code for this assembly. It's an open source library and I was just referencing the DLL.
My LineLevelBlackList.xml now has these entries:
<!-- Assemblies with known issues -->
<assemblyName>Newtonsoft.Json</assemblyName>
<assemblyName>log4net</assemblyName>
<!-- Add your assemblies to blacklist below this line -->
<assemblyName>HtmlAgilityPack</assemblyName>
Perhaps you should add HtmlAgilityPack to the list of assemblies with known issues.
-
Hi @rgelb
Ah so sorry for not clarifying that-- since the error was being thrown by the HtmlAgilitypack.HtmlNode method, you would need to either edit the security settings for the dll containing that method, or add that dll to the line-level blacklist.
I'm so glad to hear you've got things working now though!
I'm wondering- do you have the pdb file for the HtmlAgilityPack dll?
I'll make a note in our ticketing system that there may be problems with this dll, but we may hold off on adding it by default to the linelevel blacklist since users may call on the dll without using that method, or the error may not always occur.
-
Yes. I have the PDB.
-
@rgelb Ah ok, thanks for confirming that! The profiler will try to get line-level timings for any assembly that has a pdb file, so that explains why the error came up.
Please let us know if any other issues arise!
Add comment
Please sign in to leave a comment.
This does not happen if i profile the site with lesser intrusion (e.g. method timings with source only).
What can I do to remedy this? I am using Ants Performance Profiler 9.6.0.1059