Comments
5 comments
-
 Hi Kevan,
Thanks for your post. I will try to answer your question but if I have mis understood something then please ask me.
1. Only the "Memory used" graph for instance doesn't link to anything. The reason for this is that we do not have any corresponding performance counter. "Memory used" for host machine links to the corresponding graph in Analysis page.
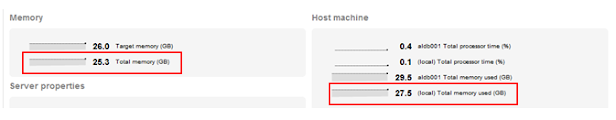
2. The memory graphs on instance page shows Target Memory and Total memory of the selected instance.
Target server memory is the total amount of dynamic memory the server is willing to consume.
Total server memory is the total amount of dynamic memory the server is currently consuming.
3. Yes, both of them point to the same counter. The reason for putting it under "Host machine" is that you can easily compare the resources used by machine and SQL Server instance on that machine. Is this confusing?
Thanks,
Priya -
The 2 counters here (taken from the instance page) both result in the same Analysis graph
and the one on the right is the same measure as the non-clickable Global Overview graph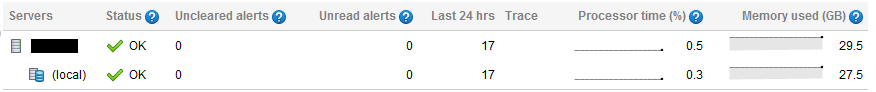
-
Apologies, my mistake.
The counter under "Host machine" i.e. "Instance name Total memory used" is the same as what is shown on Global Overview page. This shouldn't link to anything on Analysis page. I will bug it and we will fix it for V 3.0 release.
Thanks for pointing this.
Regards,
Priya -
Ah OK.
I don't mind them being non-clickable, as long as they both are!
Would it not be better to use the 'other' measure on the Global Overview then?
So in my example, make the one on the front be the 25.3GB, rather than the 27.5GB -
Thanks Kevan. Yes, we do plan to review the information on the Overview page soon. I will log this also.
Thanks,
Priya
Add comment
Please sign in to leave a comment.
Clicking the graph has no effect, and the link seems to point to "mySQLMonitorServer:8080\#"
In this example the instance memory is reported as 27.4Gb
If I drill into the server instance, I can then see 2 more small graphs for memory.
One under a section titled Memory, showing 25.3Gb of memory usage, and is clickable through to Analysis: SQL Server: total memory, for the instance
And another under Host machine showing 27.4Gb labelled "(local) Total memory used (GB)", which also clicks through to the same analysis graph.
So 3 questions:
1. why doesn't the Global Overview graph link to anything?
2. What is the diff between the 2 graphs on the instance page
3. Why do they both link through to the same analysis, although one is obviously reporting a diff measure of mem used?
I can provide screenshots to clarify if it helps